



Republican congressional candidates are facing tight races in districts Donald Trump won handily in 2024. Reuters recently reported that “major Republican groups and megadonors have begun spending in at least 39 congressional races … previously considered ‘safe.’” The Intersection has found that most of the spending by the two major political parties and allied political committees is occurring in districts Trump won by up to 11 percentage points in 2024.
Republicans’ woes are largely attributed, with reason, to the president’s waning poll numbers in recent weeks. But in fact, the Republicans’ struggles were foreshadowed in a late June survey by the Institute for the Study of Modern Authoritarianism (ISMA), publisher of The UnPopulist. The poll showed that although Trump voters applauded the signature Trump policies we tested, they exhibited somewhat less enthusiasm for Republican candidates, a Republican Congress, and indeed, Republicans generally.
This relative apathy was concentrated among the Trump voters the survey identified as “nonpopulist,” a plurality of whom were dissatisfied with the country’s direction in June. One contingent in particular stood out: Trump voters disinclined to vote Republican in the upcoming congressional race, many of whom appear economically vulnerable. They constitute almost one-fifth of Trump voters, and more campaign spending may do little to gain their vote.
The Trump Bandwagon in June
ISMA classifies respondents as “populist” supporters of their preferred presidential candidate if they exhibit at least three of four potentially populist attitudes in our surveys: anti-elite sentiment; othering of a social outgroup seen as favored by those elites; a strong personal attachment to the candidate; and a willingness to see the candidate breach legal limits on presidential power. The June survey focused on populism among those who said they voted for Donald Trump or Kamala Harris in 2024.

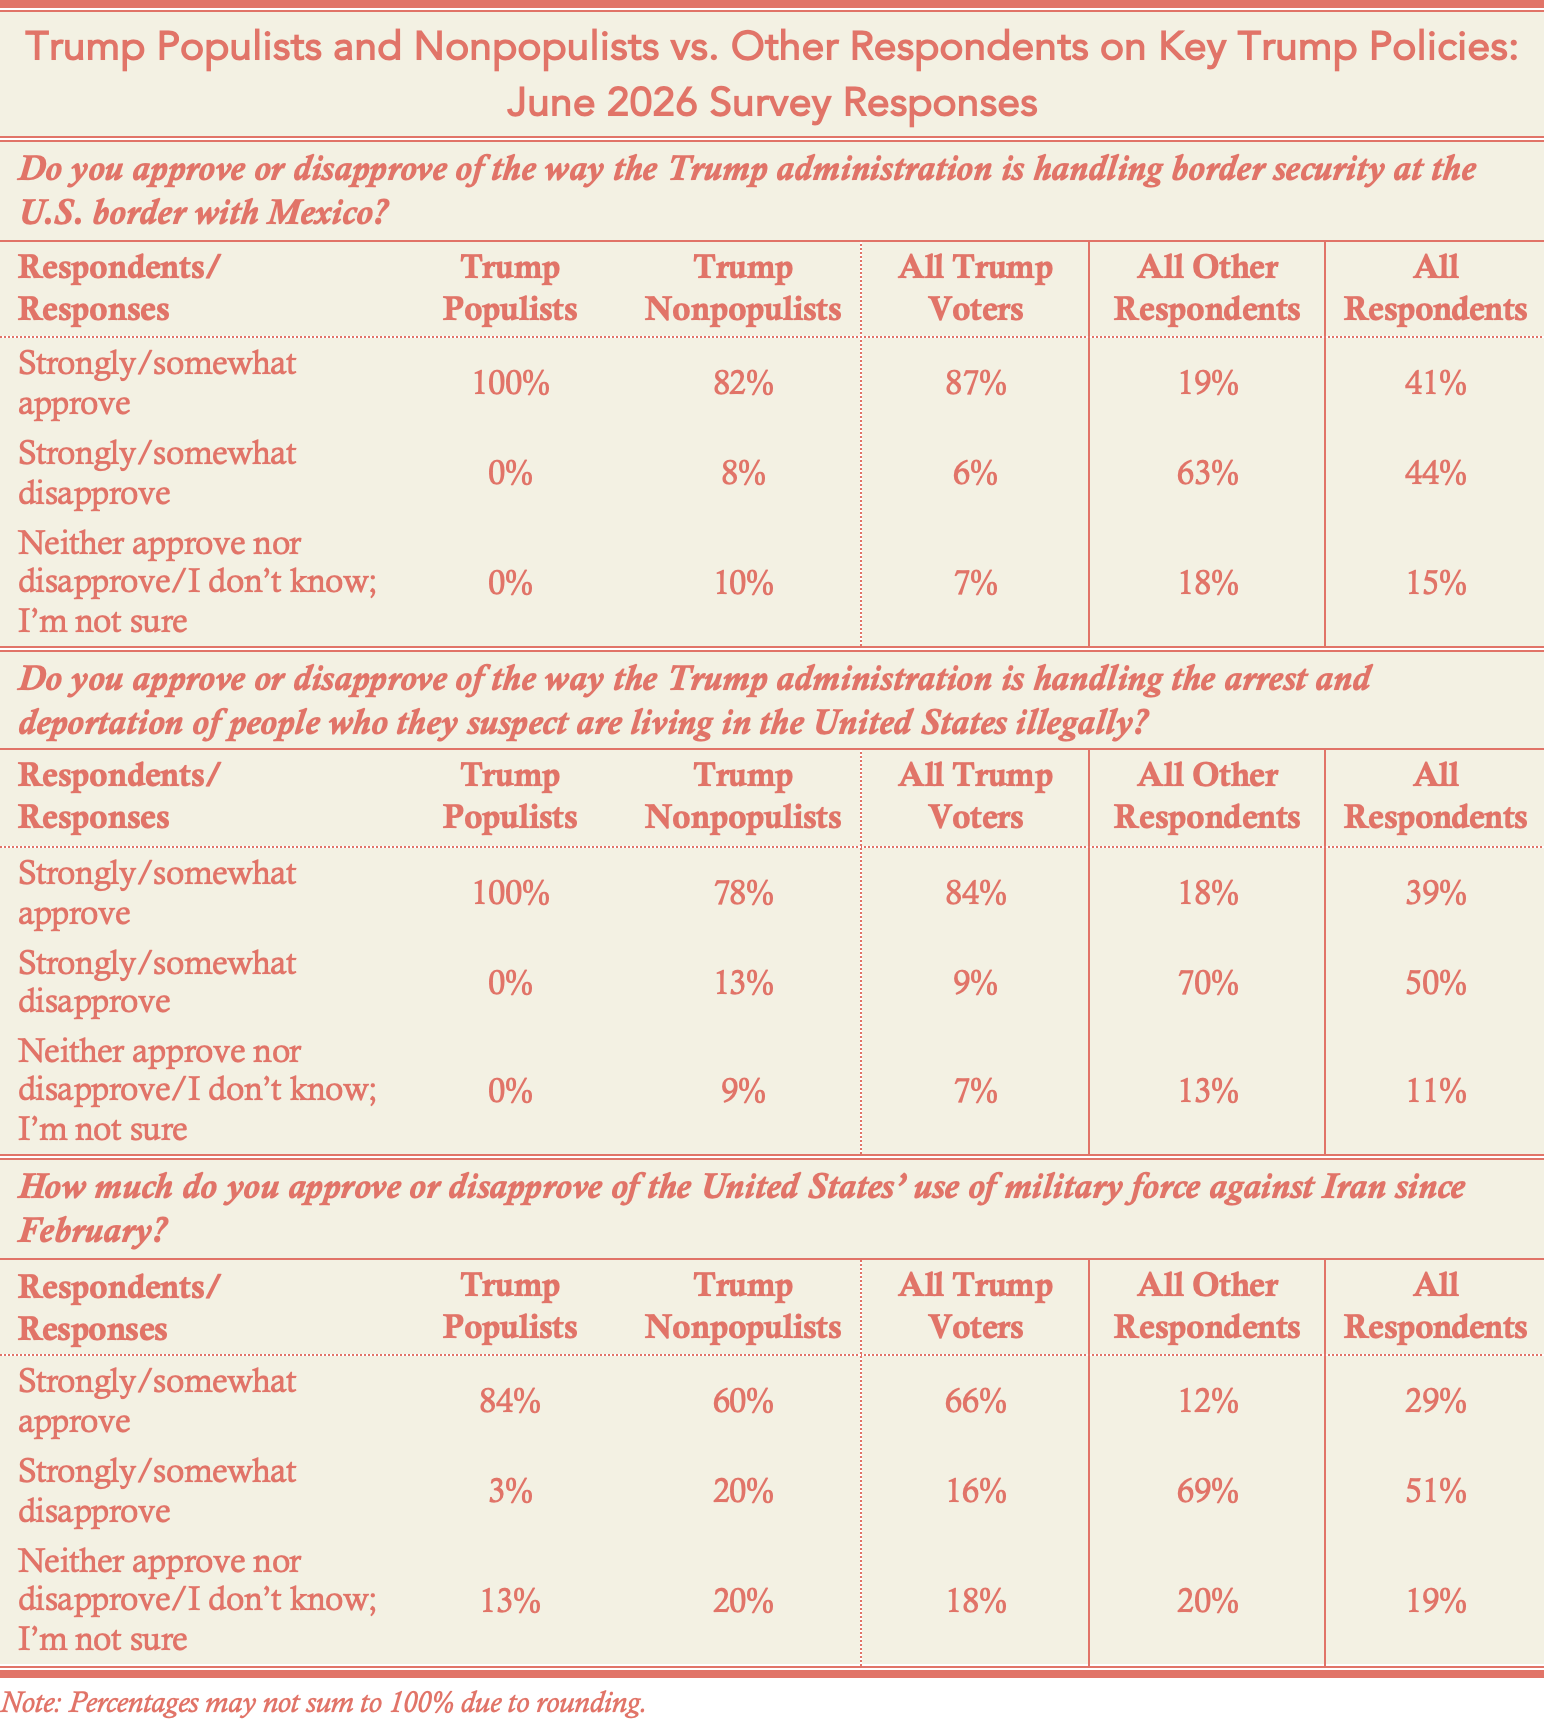
Trump voters strongly backed key Trump administration policies (see table below). A remarkable 87% approved of its handling of security at the Mexican border, including a striking 100% of Trump populists and 82% of Trump nonpopulists. They showed similar support for the Trump administration’s handling of deportations of people it suspected of living in the country illegally, with 100% of Trump populists and 78% of Trump nonpopulists approving.
Trump voters even supported the country’s use of military force against Iran. True, at the time there was a tentative peace deal, but skirmishes had recommenced and gas prices were well above prewar levels. Still, Trump populists approved 84% to 3%, and Trump nonpopulists 60% to 20%. In contrast, other Americans disapproved 69% to 12%, and they likewise disapproved of the administration’s handling of the border 63% to 19% and of deportations 70% to 18%. In short, despite the controversy, both populist and nonpopulist Trump voters remained foursquare behind him.
Yet Trailing in the Congressional Race
Although Trump nonpopulists didn’t support Trump’s policies quite as firmly as Trump populists—hardly surprising given populists’ passions—their approval was still high by conventional standards. On the upcoming congressional election, however, the gap between Trump populists and nonpopulists mattered, especially compared with the corresponding gap on the Harris side.
We asked respondents whom they would favor in their U.S. House district if the election were held that day: the Republican, the Democrat, or another candidate. We also asked which outcome they would prefer in November: a House controlled by Republicans, or a House controlled by Democrats.
On the first question, the generic Democratic candidate led the Republican, 42% to 32%, with 22% unsure. Democrats also led as the party that should control Congress, 44% to 34%, again with 22% unsure. Both leads were statistically significant.
But these are the results for all respondents, and according to the Census Bureau, only 49% of adults voted in the congressional midterms in 2018, and only 48% in 2022. To isolate likely voters, we looked at respondents who were registered to vote, had voted for president in recent elections, and said they were very likely to vote this fall. These conditions produced more likely voters among Harris supporters than Trump supporters, but we chose a variation that slightly favored Republicans by shaving almost a point off the Democrats’ lead. This produced a likely voter turnout that was 49% of the sample and helped ensure the findings below weren’t skewed against Trump supporters.

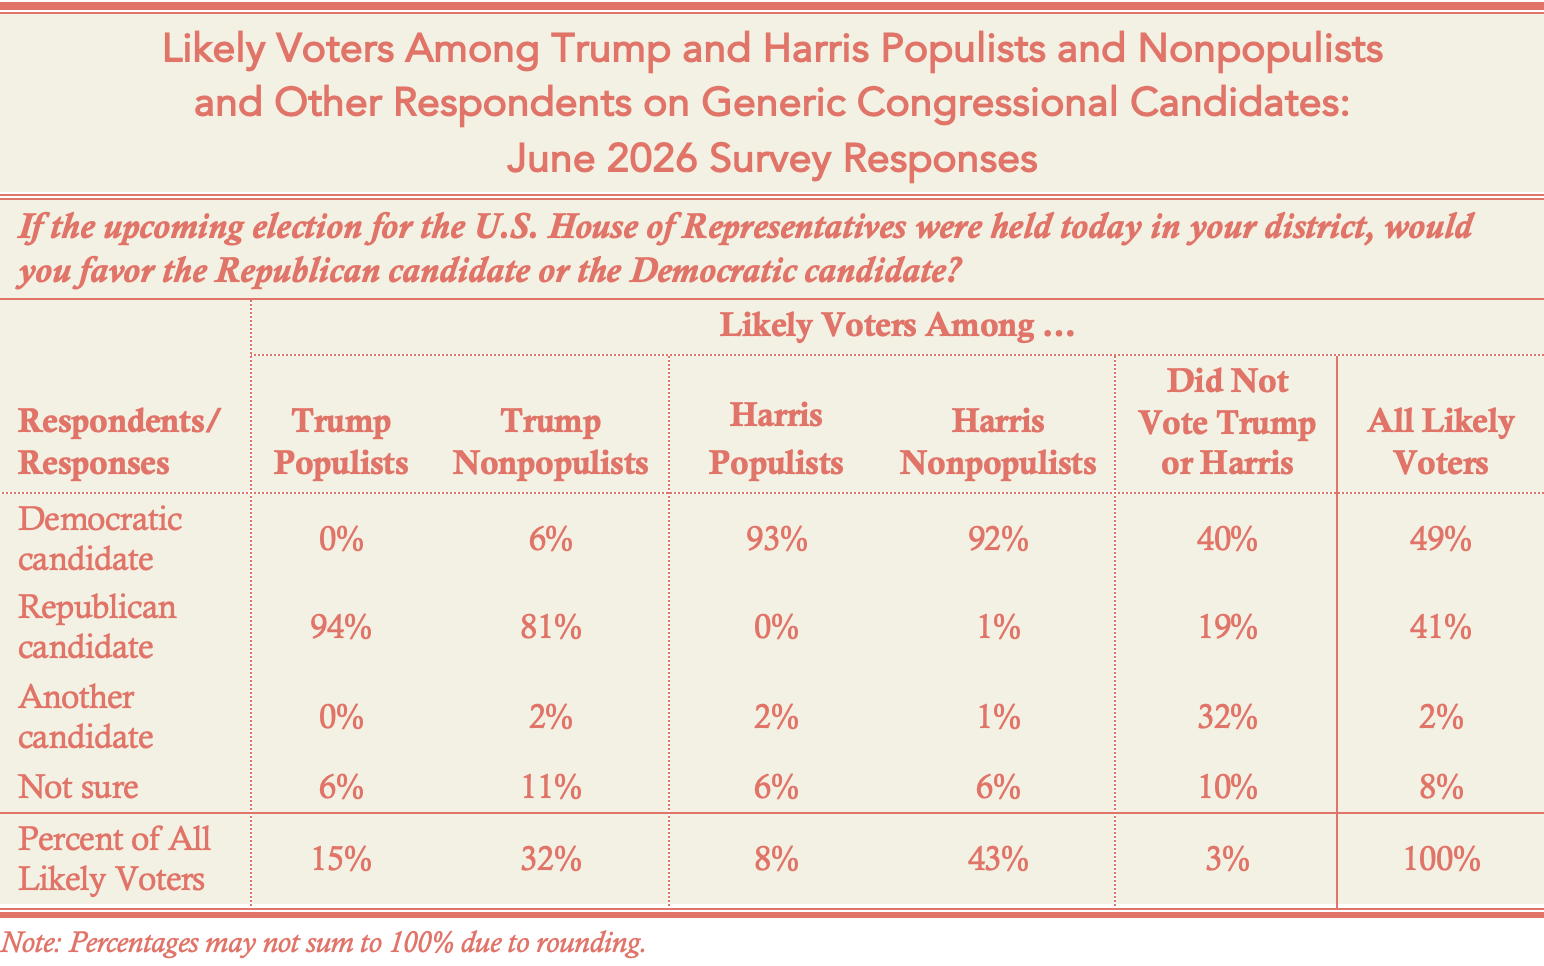
The table below shows how likely voters among six cohorts answered the House question. Start with the right-hand column: Among all likely voters, the Democratic candidate still led the Republican candidate, 49% to 41%. Though the gap narrowed a bit, the Democratic candidate came first by a statistically significant 8.5 percentage points.
The second column from the right shows the results for likely voters who say they didn’t vote for either Trump or Harris in 2024. The phrase “likely voters” is key here. People who didn’t vote for either major-party candidate in 2024 may seem like significant swing voters, but in reality, they are swing voters only at the margin because most are not likely voters. Nearly 93% did not vote for president in 2024, and only 48% are registered to vote—half the registration rate of those who say they voted for Trump or Harris in 2024. Hence, only a small portion of this group is likely to cast a ballot, and as the last row of the table shows, this fragment constitutes only 3% of likely voters. It did favor the Democratic candidate over the Republican 40% to 19%, however—a difference that could matter in a very tight race.
Most of the battle, though, is among those who voted for Trump or Harris in 2024, populist and nonpopulist. Here, a clear pattern emerges. Trump populists and Harris populists almost uniformly favored their presidential candidate’s party, 94% and 93% respectively. Nonpopulists did too, but less so: 81% of Trump nonpopulists preferred the Republican, and 92% of Harris nonpopulists the Democrat.
Notably, the dropoff from populists to nonpopulists was much larger on the Trump side (94% to 81%) than on the Harris side (93% to 92%). The 13-point difference in the former was statistically significant; the 1-point difference in the latter was not. Moreover, Trump nonpopulists chose Republicans at a significantly lower rate than Harris nonpopulists chose Democrats—a nearly 11-point difference. This gap was a major contributor to the Democrats’ overall lead.
The same pattern appears on the question of which party should control Congress: Trump nonpopulists don’t support Republicans the way Harris nonpopulists support Democrats.
Slippage in Republican Ties
Tellingly, this wasn’t because Trump nonpopulists had warmed to Democrats. We asked respondents to rate their feelings toward Republicans and Democrats on a scale from 0 (very unfavorable) to 100 (very favorable). As shown in the table below, Trump and Harris populists were mirror images, rating their presidential candidate’s party at an average of 73 and 75 respectively, while ranking the opposing party at averages of 11 and 8.
Trump nonpopulists rated Democrats at just 22 on average: warmer than Trump populists at 11, but half the overall average toward Democrats of 44, and comparable to Harris nonpopulists’ average of 20 for Republicans.
Where Trump nonpopulists differed was in their assessment of Republicans. Their average rating of Republicans, 60, was 13 points below Trump populists’ 73, a statistically significant drop. The corresponding 6-point drop on the Harris side, from 75 to 68 in rounded figures, was less than half as large and not statistically significant (though nearly so). Moreover, Trump nonpopulists scored Republicans lower than Harris nonpopulists did Democrats: 60 vs. 68, respectively—a statistically significant difference of nearly 9 points.
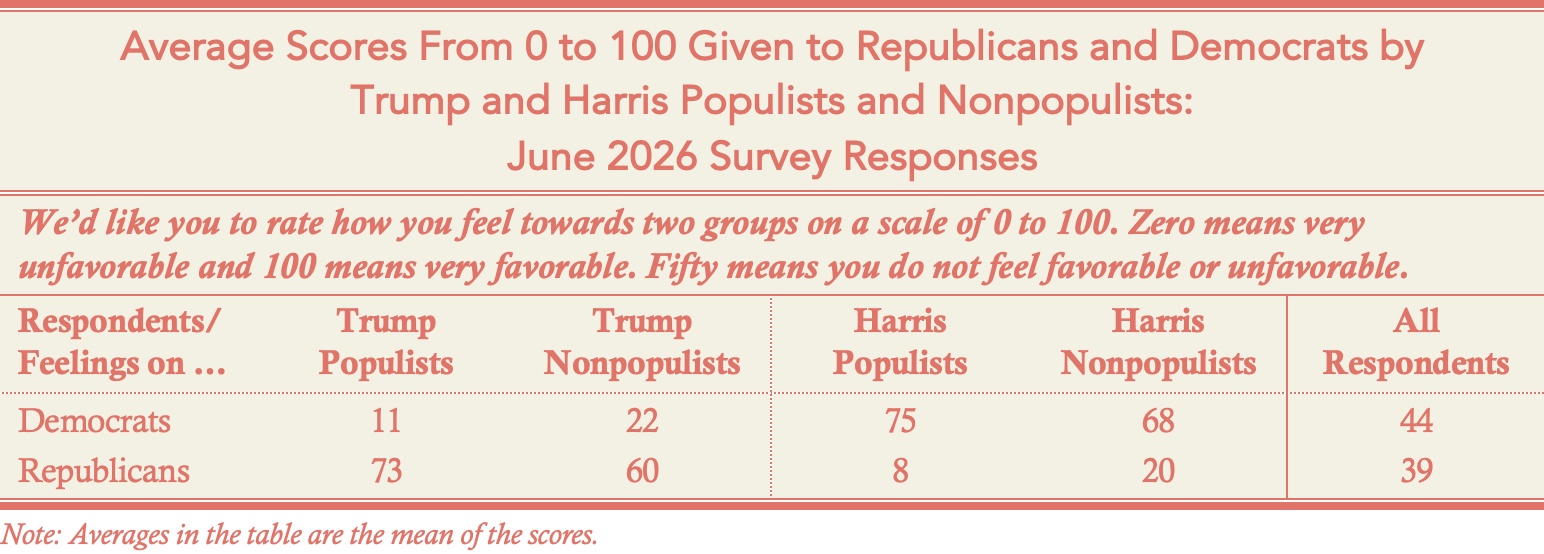
Things looked different in our August 2024 survey: Trump and Harris nonpopulists rated their own side’s party about the same, and Trump populists and nonpopulists viewed Republicans about the same; neither difference was significant. By June of this year, however, Trump nonpopulists’ rating of Republicans had dropped nearly 10 points, more than double the modest 4-point decline in Harris nonpopulists’ view of Democrats. In short, Trump nonpopulists weren’t quite the partisans they once were.
So who are the Trump nonpopulists who didn’t choose the Republican candidate in their House district in our survey?
75% did not have a college degree
52% had a family income of less than $50,000 per year
59% were unmarried
36% were part-time workers, unemployed, or permanently disabled
On average, they were about 10 years younger than other Trump voters
This profile suggests many are economically vulnerable. Perhaps unsurprisingly, 64% said in June that they were dissatisfied with how things were going in the U.S., more than twice the rate of other Trump voters. Rapidly rising prices since then may have reinforced their discontent. Of course, many partisans subdue their personal misgivings and “come home” to their party as an election approaches, but these voters weren’t very partisan. Just 41% described themselves as Republican or leaning Republican, compared to 93% of other Trump voters.
Notably, this cohort was 18% of the Trump voters in our survey. By our model, they are slightly more probable voters in the upcoming election than the average American, but they are not as likely to vote as other Trump voters are. This poses yet another problem for Republicans: Even if these Trump voters do favor the Republican candidate by November, their impact on the election will still be neutered if they don’t flock to the polls the way they did in 2024. It’s easy to see why Republicans and affiliated campaign committees might be spending money in districts that Trump won safely in 2024.
A Shifting Political Playing Field
Of course, the generic congressional ballot question in the ISMA survey doesn’t tell us about specific House candidates, and it can’t account for the impact of partisan gerrymandering or of Republicans’ and Democrats’ continued self-sorting into red and blue states. For many reasons, projected midterm election “waves” often fail to arrive.
But the survey does suggest that the political momentum has shifted on both sides of America’s partisan divide. As we’ve observed before, the populist cohort in the Trump coalition has waned since August 2024. Our findings above suggest that Trump’s nonpopulist coalition has lost some energy as well.

In contrast, both Harris populists and Harris nonpopulists appear to have gained momentum. They show strong support for Democratic congressional candidates and appear united against Trump’s agenda: 81% disapproved of his handling of the southern border, 88% disapproved of his handling of the arrest and deportation of suspected illegal immigrants, and 85% disapproved of the U.S. military action against Iran.
Further, a 64% majority of Harris voters, including 60% of nonpopulists, believed this election “will decide whether America will continue to be a democracy,” a view shared by just 34% of Trump voters.
This alarm, together with a firm disapproval of President Trump’s policies, could, as many current polls are predicting, deliver Democratic victories in Congress—the first branch of government—that may constrain the increasingly unchecked power of the second branch.

© The UnPopulist, 2026
Follow us on Bluesky, Threads, YouTube, TikTok, Facebook, Instagram, and X.
We welcome your reactions and replies. Please adhere to our comments policy.